
…Now, the story that I want to tell you began in 1971, in the middle of the year. I’d been going around, using this model that I have explained to you, in big companies, in agencies, in all sorts of places. And then I suddenly got a letter which very much changed my life. It was from the technical general manager of the state planning board of Chile [CORFO] – remember, 1971, President Allende was in office. He, er, remarked in this letter that he had studied all my works, he had collected a team of scientists together, and would I please come and take it over?
I could hardly believe it, as you can imagine! But this was to start me on a journey which made me travel 8,000 miles, over and over and over again, I was commuting between London and Santiago for two years. While that model of the viable system is in your mind, let me tell you what happened when I first explained it to President Allende himself.
Allende was a doctor, a medical doctor, as you may know. And therefore it was very easy to explain the model to him in terms of neuro-cybernetics: as the way of controlling the body. And then I went into the business of controlling the state. And so I said to him: “Let us suppose that these [System 1] elements of the state are the big departments of state, like Foreign Affairs, the economy, Home Affairs, so on. And then, we will have those, and the following things will happen, and then we must have a System 2…” – and I built it up on a piece of paper lying on the table between us – “then a System 3, and a System 4”, and I got that far…
And then I got to System 5, and I drew a big histrionic breath, and I said – I was going to say – “this, Compañero Presidente, is you!”. Before I could say it, he suddenly smiled very broadly, and he said “ah, System 5, at last: the people!”.
That was a pretty, er, powerful thing to happen. It had a very big influence on me. Ahh… I can’t go into that aspect, the political aspect in this, er, program; it’s not what it’s about. But I’m sure you’ll bear in mind that I don’t have to go and work in places where I don’t want to be.
What happened when I got to Chile, and took over this team? Let us look at a little diagram to show how I set about things…
— Stafford Beer, January 21, 1974 (133 days after Allende’s death during the Pinochet coup d’état )
The Arcane Art of Parsing Charts
For the sake of illustration, let us depart briefly from my usual subject in this blog, and address one of more general, popular interest. It doesn’t really matter which, to be honest, so I’ve chosen to go with “local crime”. One will never find themselves short on Winnipeggers ready and willing to venture an opinion on the subject – so, here’s mine:
I don’t feel any less safe today, in a general sense, than I have during my decade (or so) living in the city. It is true that violent crime has been on the rise over nearly that entire time, and also that there is far more visible poverty than at any time I can remember, but it’s not that much less safe today than it ever has been. Not really. Not in the grander scheme of things.
There you have it. And now, here is a little diagram to show you what I mean:
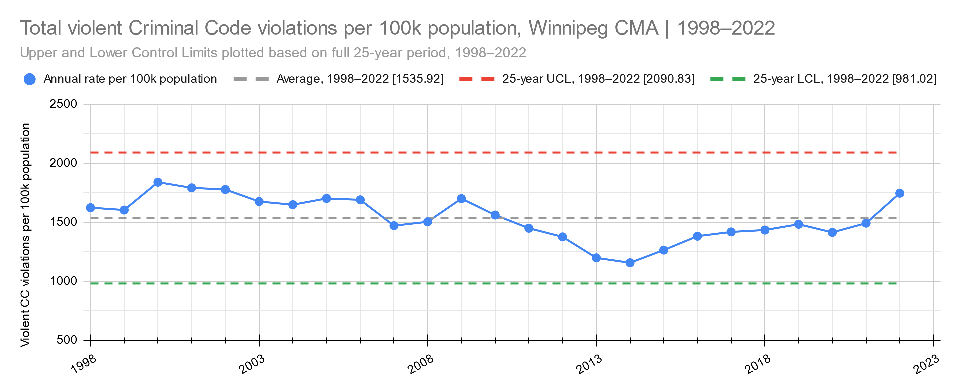
“Control charts“, such as the one above, were first conceived in 1924 by Walter A. Shewhart – at that time, an employee of the Hawthorne Works, and soon thereafter as a founding member of Bell Labs. A mathematician and engineer by training, Shewhart’s innovation was to apply two interrelated and highly useful concepts, drawn from statistical theory, to the assembly lines and shop floors which formed the very beating heart of “Ma Bell“:
- The central limit theorem posits that, for a given “random variable” under observation, as the number of samples taken increases, the full population of sampled values will come to approximate a “normal” or “Gaussian” distribution – better known as a “bell curve”.
- A simple demonstration of this principle might involve rolling two or more dice a few dozen, hundreds, or millions of times, while noting their combined value after each roll.
- Shewhart had observed that oftentimes, the measured outputs of Bell’s manufacturing processes (such as the number of defective units produced on a line per day) tended to be nearly, though not actually, normally distributed.
- The “three sigma rule“ holds that for a given (normally-distributed) random variable, roughly 99.7% of all observable data-points will fall within three standard deviations (that is, ±3σ) of the mean (that is, average) value of all samples taken.
- This phenomenon is also known as the “empirical rule”, or the “68-95-99.7 rule”.
- Given these two points, one can predict with high belief that the observed outputs of a given process, with respect to some given real-valued quality characteristic(s) we wish to study, should tend to remain within “three sigma” of the recent “process mean” performance, provided that the process being studied remains “stable”. Shewhart described this stability as “the state of statistical control“.
- When a data-point falls within this range, Shewhart called this “chance cause” variation. Such a result is predictable, and to be expected based on past performance.
- When a data-point falls outside of this range, Shewhart called this “special cause” variation. Such a result is atypical, or “out of control”, and often signals some significant change has occurred in the process which merits further analysis and/or action.
- Over the years, several other “rules” have been proposed which can help to spot other key shifts or trends in one’s sampled data.
This is all a bit (but not much!) of an oversimplificatio, and I’ve probably explained some of it poorly. Sincere apologies to any actual statisticians who might be reading (to say nothing of anyone actually employed in formal QA/QC), but I think that’s just about all of the theory one needs in order to start gainfully interpreting (most types of) process control charts.
Anyways, we had been discussing local crime. I’ll tell you what does worry me lately: murder. It’s not so much for myself, mind you – my personal circumstances are such that “homicide” remains exceedingly unlikely as my cause of death. No, what worries me is how it’s becoming abundantly clear that, whatever other benefits might stem from pouring a quarter of our municipal services budget (and growing!) into the Winnipeg Police Service, “fewer murdered Winnipeggers” is categorically not among them. But it is rather worse than that, I fear: ever since the pandemic, sometimes it can feel like the murder-rate in Winnipeg has been out of control.
Again, this is pretty dull, uncontroversial stuff – the sort of opinions you might hear anywhere in a city with occasional claims to the title of “Canada’s murder capital”. And here, again, are some charts to show you why I feel so confident in relaying them here:
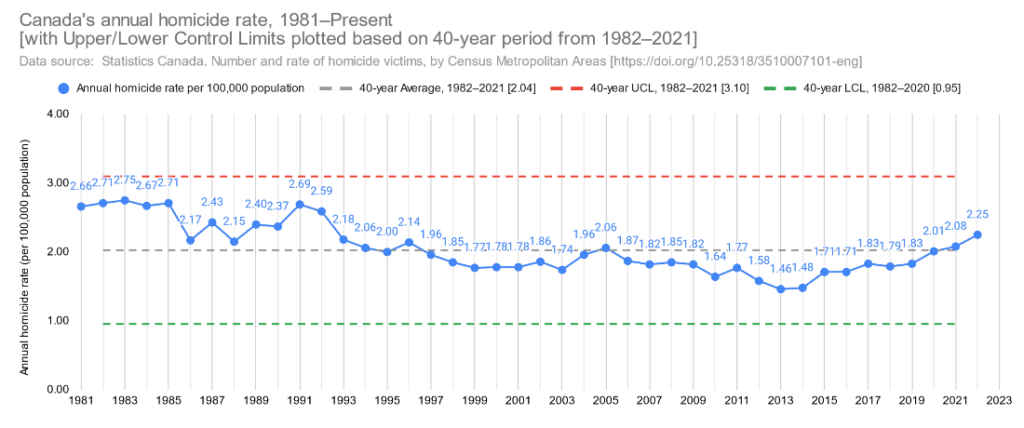
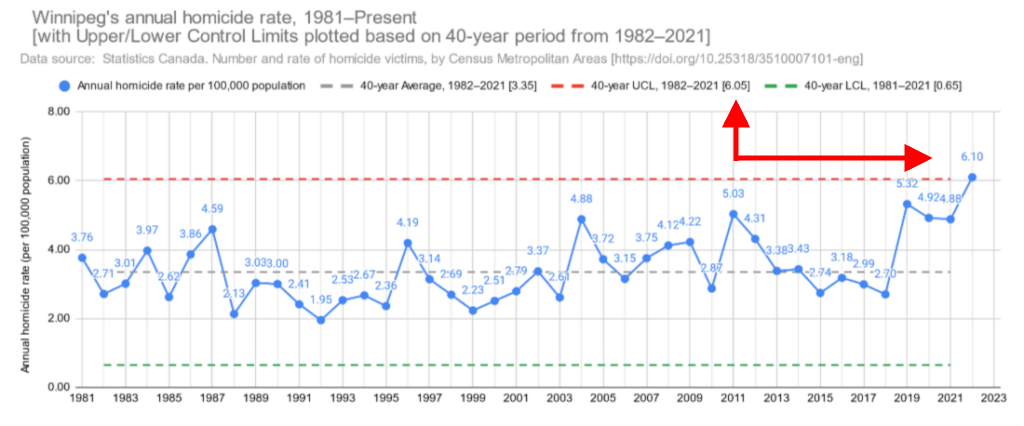
My point in sharing the charts above is not to prompt some general alarm over my local homicide rate (though I will grant you that alarm would have been appropriate eighteen months ago, when this data first became available). Nor am I holding these graphs up as certain proofs of the correctness of my opinions, since you could jiggle a few parameters around a bit and wind up with a similar chart to “prove” that no, actually, the murder-rate was still inside its control limits last year, so its fine actually, everything is fine, please go away.
Rather, I present them so that you, the reader, might spend a few moments interpreting and appreciating “control charts” for yourself, and reflect on whether — and to what extent — they succeed in their more overtly rhetorical aspects:
- What “arguments” is the chart making about the process, and/or the data being plotted?
- In essence: “Here is the range of values that are likely to occur in the near future, based on our recent experience, and assuming that no substantive changes are made“.
- How would one know, according to the chart, if and when there’s a problem with the process?
- “If the next sample falls somewhere between the ‘control limits’, this is normal. Continue to monitor the process and integrate new data into the model.”
- “If the differences between samples grow larger, then the standard deviation of the set will increase. Future performance will therefore be less stable/predictable.”
- “If the next sample falls outside of the ‘control limits’, something has changed. Investigate and resolve.”
- What is the “ideal state” for the process being studied, according to the chart?
- In some contexts, the goal might be to reduce process variation, thereby leading to more consistent, more predictable outcomes in future.
- In other contexts, one might seek instead to achieve some result which exceeds one of the known “control limits” of the process, to the operator’s advantage.
- Returning to our previous example, we can predict that Winnipeg’s annual homicide rate will rarely, if ever fall below 0.65 per 100,000 population (or about six homicides annual, given its current population), so long as the existing system we’re evaluating remains unchanged. This figure would make for a sensible “target homicide rate” for the relevant stakeholders to adopt. In any case, it is a far more sensible and useful target than the more popular (and overtly political) sentiment, often espoused by police spokespersons and public relations staffers, that “one is too many“.
I would pose one further question: can you recall having ever seen local crime statistics expressed or presented to you this manner before? Indeed, can you recall having seen any species of data communicated to you in this way? For this example, I chose “crime” as my topic here, but we might just as easily have been discussing housing costs, or the rate of inflation, or the game-day attendance for your preferred major-league sports franchise. I am now asking you: have you ever seen a “control chart” on your local newscast? Or reproduced in your local newspaper? Heard this-or-that elected official boasting about some recent success (or defending some recent failure) in terms of their department having “exceeded the upper control limit based on the prior eighteen months”?
These are, of course, rhetorical questions, but they are also questions of rhetoric. I ask them in the hope of prompting you to reflect on the myriad examples of “statistical rhetoric” with which one is confronted in one’s daily life, and whether they prove any more or less illuminating than the readily imaginable alternatives.
Over the past few years, I have found ample opportunity to produce, maintain and study “control charts” in the course of my professional work, since digital advertising also involves large volumes of noisy, messy data, derived from (and about) highly complex and variable processes. You might even recall (from Part I) that this complexity was the very first point I wanted to address when describing this work to a class of aspiring marketers. More recently, I have also been struck by the notion — as perhaps you might now be struck — that the absence of any comparable data-vis tool from the “media diet” (so to speak) of the average Canadian shouldn’t go unremarked, nor uncritiqued.
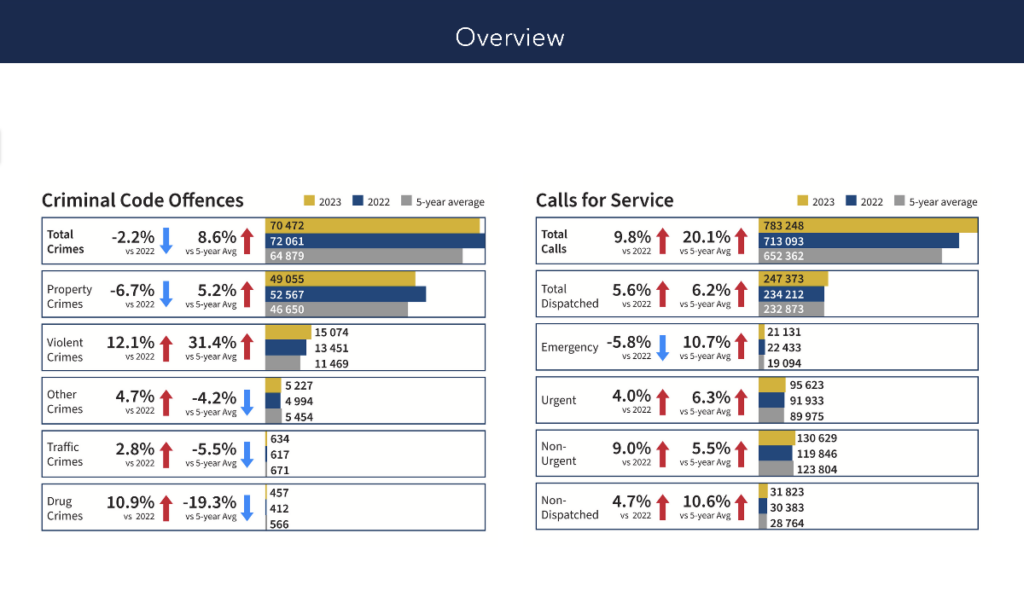
As if to make my point, here is how the Winnipeg Police Service opted to share their latest crime stats with the local public when — in a bit of serendipity — they released their 2023 Statistical Report last week. Winnipeg’s local news media then set about amplifying these very same charts and data-points, largely undecorated by further journalism:
Another Beer, Please
The ironic intent behind the title of the fourth lecture from Designing Freedom — “Science in the Service of Man” — becomes obvious from almost the very start. Stafford begins with a few brief sketches intended to convey the myriad ways by which, to his mind, “science and technology are driven relentlessly forward towards a society of conspicuous consumption, since this is the only development that our economic machinery can countenance… [b]ut I believe that the society of conspicuous consumption is proving to be the most alienating force the world has ever known, and that the fantastic consumption of drugs (both legally prescribed and illegally acquired) is a useful index of the degree of alienation now in evidence”.
That is the gist of his introduction, anyways. I’ve summarised it here in part so that you might skip reading or listening for yourself, but mostly because it helps to tee up these next few vital passages:
What does this brief analysis purport to show? It argues that the sense in which people accept that science serves man is a false sense, since science is in these typical ways being used to destroy man—in his humanity and in his joy of living. Moreover it is getting through to decent people that on a planet the resources of which are only now becoming recognized as finite, prosperity for all is a delusory goal. We buy increasing prosperity for we few at the expense of the many who can never attain it. As the alienation grows, there is increasing resistance to the idea of yet more science, with the result that new proposals for handling old problems by the use of computers and telecommunications are often greeted with something approaching public hysteria. I am thinking of electronic files on the citizen, or the kind of governmental control system that I described earlier. The point is that this panic is well justified, so long as society continues down the existing path, following its technological nose. Yet if societary institutions are to escape the fate of catastrophic instability, we shall very certainly need new systems of these kinds.
It follows that science has to be handled in a new way. There is only one solution that I can see. It is to remove the control of science and technology from those who alone can finance its development, and to vest its control in the people. As to scientists and technologists themselves, they are truly servants of that public; whereas the present tendency is to turn them into an elite instrument of those who have the economic power over scientific systems themselves. That way lies technocracy, and we are perilously close to it already.
— Stafford Beer, “Designing Freedom” (1973), p. 28-29 [emphasis mine]

…Obviously, I am trying to dig beneath the surface layer of science and technology as we know it in society, to uncover new strata of scientific potentiality. The societary use of science we have is threatening; it becomes oppressive and alienating. The societary use of science we could have is a liberation. To grapple with that idea, I well understand, needs courage and resolve; the risk is that folk who see the very real dangers will turn their backs on the whole difficult business. But how safe would our great-grandparents have felt if plunged suddenly into a modern home, a modern street?
We have had three or four generations in which to adapt to a house alive with lethal electricity, a road alive with lethal trucks. We have had barely twenty years to adapt to the inventions and discoveries that these lectures discuss. Then no wonder the adaptation is not coming along too well yet. No wonder people feel at ease with an automobile that they literally dominate, and ill-at-ease with the computer which they do not. The interesting thing is that a majority (perhaps) of automobile-dominators do not understand exactly how those machines of theirs work, and yet use a similar ignorance of the computer’s viscera to explain their distrust of it.
Be that as it may, the problem of rapid adaptation for the individual that has now emerged is a similar pattern—in cybernetic terms—to the problem of rapid adaptation for the institution. Let us try to analyse the modern individual’s problems in the language that we have been learning, because this problem is indeed a problem of effective organization.
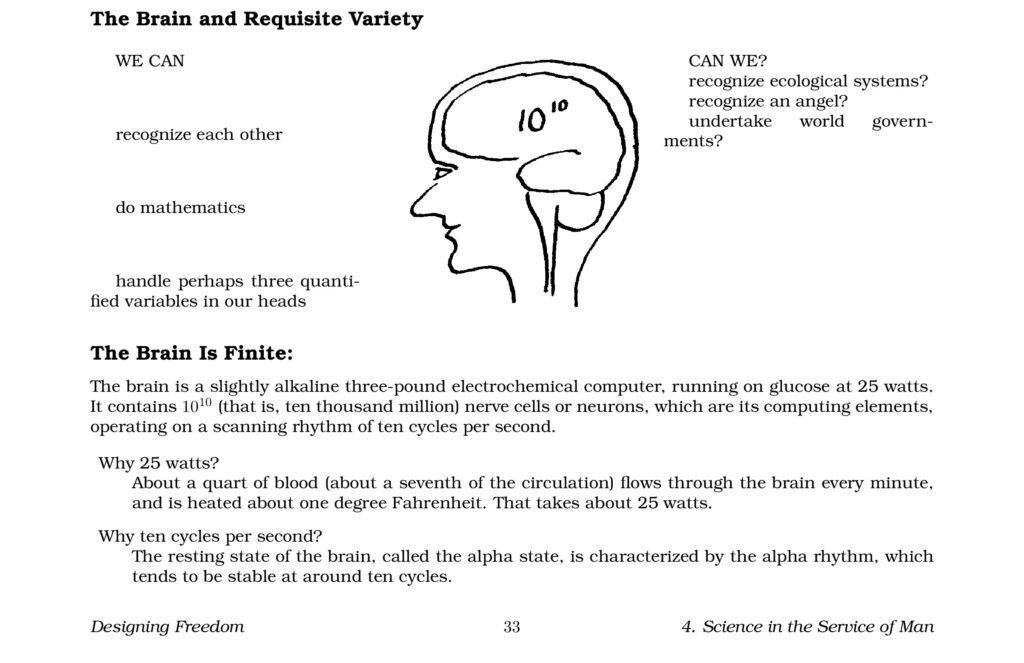
The first thing we have to face up to is quite a tough proposition for people reared in our culture. It is that whatever we humans can do is mediated by our brains, and those brains are finite. We have in the cranium a slightly alkaline three-pound electrochemical computer running on glucose at about 25 watts. This computer contains some ten thousand million (that’s ten to the ten) logical elements called neurons, operating on a basic scanning rhythm of ten cycles per second. Then this is a high-variety dynamic system all right; but it really is finite. It follows from Ashby’s Law that we can recognize patterns up to a certain limit, and not beyond. Thus if something is going on that involves a higher variety than the brain commands, we shall not recognize what it is. This is the old constraint of requisite variety again.
There are practical consequences to this. For instance, I am sure that the reason why we are making such a hash of the problems of global ecology is that we cannot understand them. I don’t just mean that they are awfully difficult, so that understanding will take a lot of research. I mean that we can not understand at all, ever. Very likely this goes for many problems of government too, especially world government. It may even be true at the level of recursion where a corporation is managed. May I recall that the level of recursion is simply the focus of attention at which we contemplate any viable system, and that one level is contained within the next. So here is an unpleasing thought: maybe it is also true at our personal level of recursion. Perhaps we cannot actually understand our own lives, our own environment, any longer.
Now with or without full understanding, with or without the requisite variety to detect vital patterns, we have to cope somehow at all these levels. Of course we do it by making mental models. We simplify, so that the system we are considering will map onto our own brains. But that can be done only by attenuating variety, and we have no guarantee that we are not throwing the wrong information away. It is fairly evident that we shall become accustomed to discarding information in set ways, and to eliminating inputs that do not seem to fit very well the models we have developed. I think this must mean that what we all refer to as “reality” is a version of the universe that is very much cut off at the knees. To be rude about it, you could say that our humanity exists in sharing a delusion about the way things are.
At this point I would love to start talking about mysticism, or about psychosis, or about psychedelic drugs—especially I would like to talk about the relations between them. Because these three things have this much in common: they claim to deal with aspects of reality which our shared delusion filters out. But the point I was really after is this. The currently explosive rate of change produces perturbations at intervals that are shorter than the relaxation time of our institutional system: that was my earlier hypothesis. I have pointed to its realization in Chile. I now extend that hypothesis to cover you and me as individuals. Can it be, perhaps, that we all suffer from a variety overload that we cannot map onto our models, and from an ungovernable oscillation in our search for mental equilibrium? In short, is our species facing the same threat of catastrophic instability as I earlier argued that our institutions are?
— Stafford Beer, “Designing Freedom“, 1973, p. 29-30 [emphasis mine]
Towards the conclusion of the fourth lecture, Beer returns to this theme, with even greater bluntness:
The brain is a finite instrument that mediates all our experience. It has high variety, but not necessarily requisite variety for handling an environment of exploding complexity. It has a relaxation time that was fast enough to deal with a world in which perturbations came at a particular rate, but it is not necessarily fast enough to offer a guarantee of equilibrial response in the current world.
This brain has certain powers, and these are essentially computational, which make it the most developed regulatory system the world knows. But my cybernetic interpretation of the evidence from biology, psychiatry, pharmacology, and criminology, is that this brain (and again that just means you and I) is by now seriously threatened by a possible catastrophic instability. Finally, this brain simply does not have the powers of untold resilience or infinite self-improvement to which three thousand years of pre-scientific culture have laid a spurious claim.
Please now hear me when I add that these considerations make no commentary whatsoever on matters that may (or may not) lie outside the physical domain. If mankind can indeed receive the divine afflatus, the point remains as I rather carefully put it just now—that the brain is a finite instrument that mediates all our experience, and is therefore limiting. As a personal aside, let me say that I am more interested in the fact that I could not recognize an angel if I met one, because my brain does not have requisite variety, than I am in the illegitimate scientific argument that angels do not exist because I have not recognized one yet.
— Stafford Beer, “Designing Freedom“, 1973, p. 32 [emphasis mine]
Third Fourth Time’s the Charm
We have finally arrived — three posts and several thousand words later — at a point where I feel ready to tackle Beer’s notion of the “electronic mafia”, which had sparked my interest in beginning this series in the first place. But since this post already clocks in at a little over five thousand words, and even though I was hoping to avoid it, I shall be extending this into a four-parter. I’m very sorry.
With this post, I wanted to introduce Stafford Beer’s views on the essentially finite nature of the human mind, and the “proper” role of the sciences and technology in a free and democratic society. I also felt it necessary to talk about “control charts”, an altogether unrelated concept with origins not in cybernetics per se, but rather in Shewhart and Deming‘s early research in the field of “statistical process control”. I did so because I wanted to offer a glimpse at the solutions that might readily be brought to bear against the sorts of challenges that Beer described fifty years ago (and/or the ones I’ve been describing here), but which nevertheless remain firmly entrenched as “live issues” today.
Before you go — and in light of this being National Indigenous History Month — I have one more story I’d like to share:
In 1793, at the age of nineteen, an Englishman named James Monkman boarded a ship named Prince of Wales, along with this brother, as it embarked on its maiden voyage to York Factory. Unlike the rest of the ship’s crew, the two were not “servants” of the Hudson’s Bay Company (HBC); rather, they had stowed away while the vessel was at port in England, and only made their presence known after the ship had been at sea for several days (the Ships’ Logs apparently corroborate this account, but I’ve not read them myself; the curious fact that James’ contract with the HBC was signed upon arrival in “Rupert’s Land”, rather than while still in England, would also seem to support this version of events).
Over the next twenty years, James Monkman would embark on a career as an HBC sailor and fur trader, at times serving as an Assistant Trader at both Severn and Island Lake. Around 1804, he married à la façon du pays to “Mary”, a Swampy Cree woman whose other names are not recorded. When James retired from HBC service in 1816, aged forty, he and his young family moved into the area of the Red River Settlement, on “Selkirk’s Grant” (Thomas Douglas, 5th Earl of Selkirk, was at that time the HBC’s majority shareholder, reportedly controlling about one-third of all company stock). By 1818, James and his family would establish the “Monkman’s Salt Works” near Lake Winnipegosis, in the area of what is today named Salt Point, Manitoba. Mary and James would go on to raise nine children (of their own) by the time they were church-wed, in an Anglican ceremony celebrated in present-day Winnipeg in 1827.
Let us skip ahead thirty years, to a time when both the British and Canadian governments — each eager to learn whether there might be any more useful lands to be annexed in this part of the world — would fund “scientific” expeditions to the Red River Valley and beyond. The Canadian party was led by Henry Youle Hind, and departed from Toronto on 23 July, 1857. A little over two months later (it was October 4th, according to Hind’s account), the Canadians would arrive at the Monkman family saltworks, where they were greeted (and guided, for a while) by Mary and James’ youngest son, John Monkman.
Here is a relevant excerpt from Hind’s account of the expedition:
At the “Works” there are two small log-houses and three evaporating furnaces. The kettles, of English construction, are well-made rectangular vessels of iron, five feet long, two feet broad, and one foot deep. They are laid upon two rough stone walls, about twenty inches apart, which form the furnace. At one extremity is a low chimney. The whole construction is of the rudest description, and at the close of the season the kettles are removed, turned over, and the furnace permitted to go to ruin, to be rebuilt in the following spring.
The process of making salt is as follows: When a spring is found, a well, five feet broad and five feet deep, is excavated, and near to it an evaporating furnace erected. The brine from the wells is ladled into the kettles, and the salt scooped out as it forms, and allowed to remain for a short time to drain, before it is packed in birch bark roggins for transportation to Red River, where it commands twelve shillings sterling a bushel, or one hundred weight of flour, or a corresponding quantity of fish, pemican, or buffalo meat, according to circumstances.
The brine is very strong, — thirty gallons of brine producing one bushel of salt; and from one kettle two bushels of salt can be made in one day in dry weather. There are nine kettles at the “Works,” seven being in constant use during the summer season. The Half-breeds engaged in the manufacture complained of the want of fuel—in other words, of the labour and trouble of cutting down the spruce and poplar near at hand, and the difficulty of hauling it to the furnaces, — an objection of no moment, but characteristic of some of the people, who are generally unaccustomed to long-continued manual labour.
It will be seen that the processes employed in the manufacture of salt are of the rudest description, so that without any outlay, beyond a few days’ labour, the quantity might be largely increased. I spoke to John Monkman, who now makes salt here, of pumps and solar evaporation. Of a pump he knew absolutely nothing. He had heard that such an apparatus had been contrived, but had never seen one. He readily comprehended the advantage to be derived from pumping the water into shallow troughs, dug in the retentive clay near the springs, and strengthening the brine by solar evaporation. An Indian guide, who accompanied us up the Moss River, assured me that all along the west coast of Winnipegosis and Manitobah Lakes, there are salt lagoons and springs. The Indians we met on the Dauphin Lake made the same acknowledgment, but declined to give precise information, alleging that the manufacture of salt drove away the game, and spoiled their hunting.
— Henry Youle Hind, Narrative of the Canadian Red River Exploring Expedition of 1857 and of the Assiniboine and Saskatchewan Exploring Expedition of 1858, Vol. I, Chapter 25
Lately, I find myself thinking a lot about great-great-great-great-great-uncle John, who helped to run one of the largest “industrial” sites on the Canadian Prairies during his lifetime, but who never lived to see (or use) a functioning water pump. I assume as much, at least — he died soon after, in 1861, when another man named Paulette Chartrain (a distant relative to David Chartrand) stabbed him between the ribs, during an argument over a salt kettle. Chartrain would be tried at the Quarterly General Court of Assiniboia, found guilty of manslaughter, and was sentenced to ten months imprisonment (of which he served six). James Monkman would survive his youngest son; he is buried at the Old Stone Church in St. Peter, Dynevor.

Credit/Source: “Salt-Making in Manitoba” by Virginia Petch
I find myself thinking about Hind — an unambiguous racist, if it needs saying — who dismissed the complaints of the local workforce out-of-hand as being “of no moment”, while in the same breath declaring their worksite to be “of the rudest description”, and asserting that with even a modicum of effort and know-how, the whole operation could be made greatly more capable and fit-for-purpose. “By the employment of simple artifices”, Hind remarks elsewhere in his report, “the yield might be greatly increased, and its market value reduced to one-fourth the price it brings at the settlements”.
One hundred and sixty-some years on from them, you and I face altogether different challenges than those of our forebears. Our worlds, our technologies, our labours and our anxieties are all starkly unalike. However I do not believe for one moment that we are changed all that much, for all the intervening years. People, for better and for worse, may still be relied upon to be people…
But, here is a pump. I have tried to explain its workings to you, as best I can. May you readily comprehend the advantage to be derived!
-R.